
Key takeaways
- A candle shows open, high, low and close for a period.
- Market hours shape charts: stocks gap between sessions, forex gaps at weekends, crypto rarely gaps.
- Patterns summarise past trading; their predictive value is limited and uncertain.
Anatomy
- Body: from open to close; filled or red if the close is lower, hollow or green if higher.
- Upper wick: the high of the period.
- Lower wick: the low of the period.
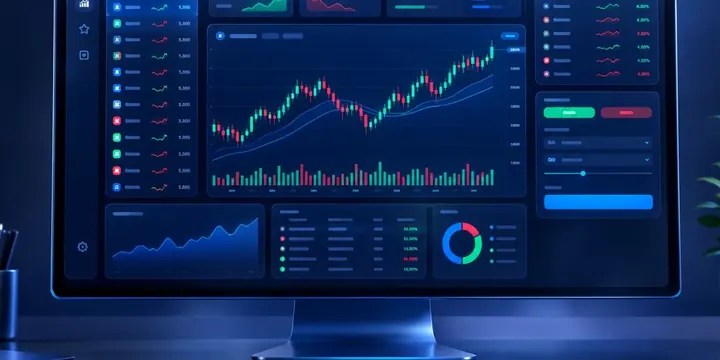
Same chart, three markets
| Forex | Stocks | Crypto | |
|---|---|---|---|
| Daily candle starts | 17:00 New York (most brokers) | At the exchange open | Usually 00:00 UTC, varies by platform |
| Gaps | Mostly at the weekly open | Often at each daily open | Rare |
| Volume data | Broker's own tick volume | Exchange-reported volume | Per-exchange volume |
Because forex has no central exchange, "volume" on FX charts is usually the broker's count of price changes, not total market volume.
Timeframes
A daily chart gives context; hourly and shorter charts show intraday swings, heavily shaped by sessions and news. Many traders check a higher timeframe before acting on a lower one.

Patterns traders talk about
- Doji: open and close nearly equal; indecision.
- Pin bar / hammer: long wick rejecting a price area.
- Engulfing: a body that covers the previous body.
- Inside bar: a candle within the prior candle's range; a pause.
Limits
Patterns are descriptions, not forecasts. Evidence that they predict future prices is mixed, and trading costs erode small edges. Using them without a stop-loss and proper sizing is risky. See the position size calculator.
Common questions
Why does my forex daily candle look different on another platform?
Brokers may start the day at different times, producing different daily candles.
Are Heikin-Ashi candles the same?
No. They average prices to smooth trends, so their open and close do not match actual traded prices.